The Huatung Basin (HB), located at the leading edge of the Philippine Sea Plate, plays a crucial role in the oblique subduction and mountain-building processes in the Taiwan region. Previous studies have reported a wide range of ages for the HB, from 30 to 130 million years, making it challenging to accurately constrain regional tectonics.
A research team led by Assistant Professor Justin Yen-Ting Ko has analyzed teleseismic waveforms recorded in Taiwan that traveled through the slab associated with the HB. Utilizing age-dependent subduction zone thermal models, they estimated the thermal ages—or the time since the last significant heating event—of the HB. Their best-fit model suggests thermal ages ranging from 20 to 50 million years, aligning with various geophysical observations and ages inferred from geomagnetic anomaly data.
However, these results differ significantly from ages obtained through radiometric dating of rocks dredged from the seafloor, which suggest much older ages. This discrepancy may be due to thermal rejuvenation of the plate—meaning the plate was heated and “reset” more recently—or because the dated rocks are not representative of the basin itself but are instead allochthonous samples collected from its borders.
This study provides new insights into Southeast Asia’s geological evolution and underscores the importance of integrating geophysical methods to resolve discrepancies in tectonic age estimations.
The research was published in the Nature Research journal Scientific Reports:
Ko, J. Y.-T.*, B.-Y. Kuo, S.-C. Lin, & Y.-S. Hung (2023). Thermal ages of the Huatung Basin determined from seismic waveform modeling: insights into Southeast Asia’s evolution. Scientific Reports, 13, 15201. https://doi.org/10.1038/s41598-023-42454-x
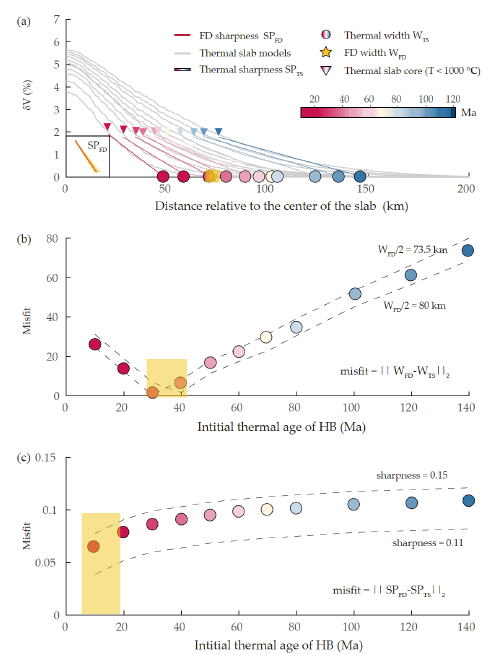
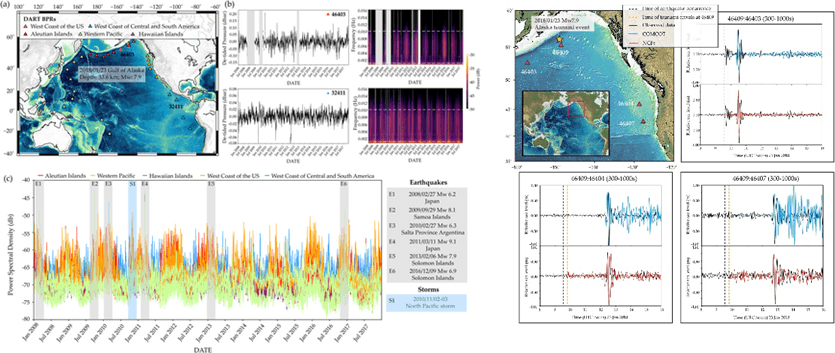
Fig. 1. Age determination. (a) The thermal slab models yielded δV values, with the gray lines indicating the predictions obtained from age-dependent models. The color-coded lines indicate the linear regression results of δV values ranging from the edge of the thermal slab core (color-coded triangles) to 0.1. The yellow star and color-coded circles indicate the estimated width of the slab from seismic and thermal slab models, respectively. (b) Misfit of slab width between the seismic and thermal slab models at different ages (color coded). (c) Misfit of sharpness between the seismic and thermal slab models at different ages (color coded).