Marine 3D seismic volumes from 2D seismic survey with large streamer feathering.
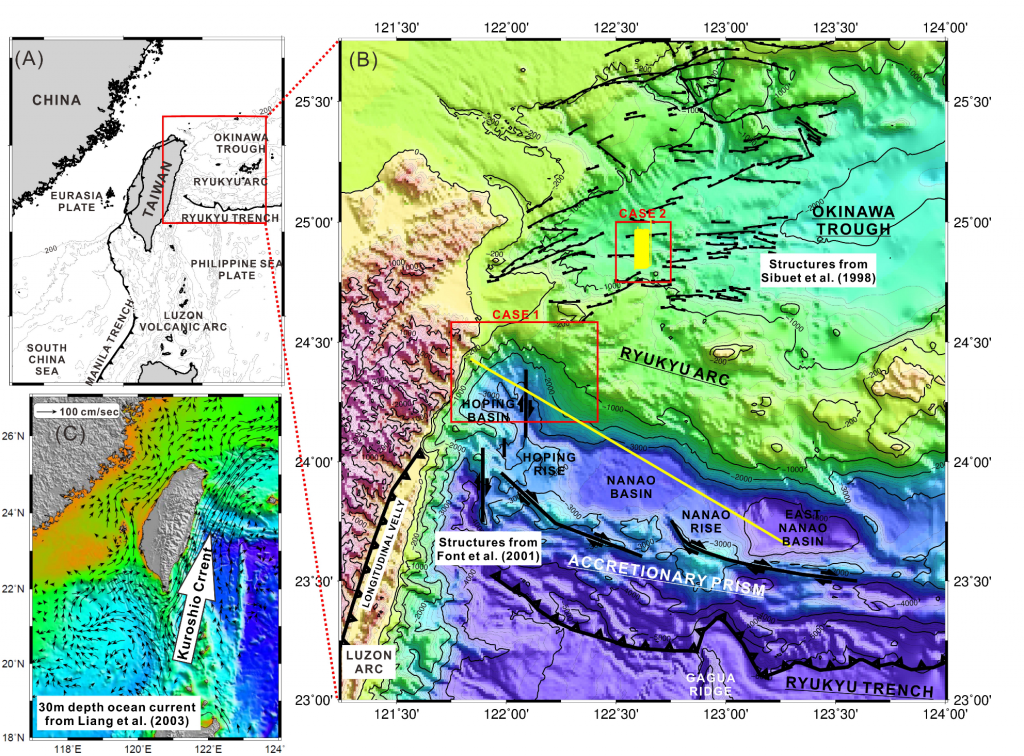
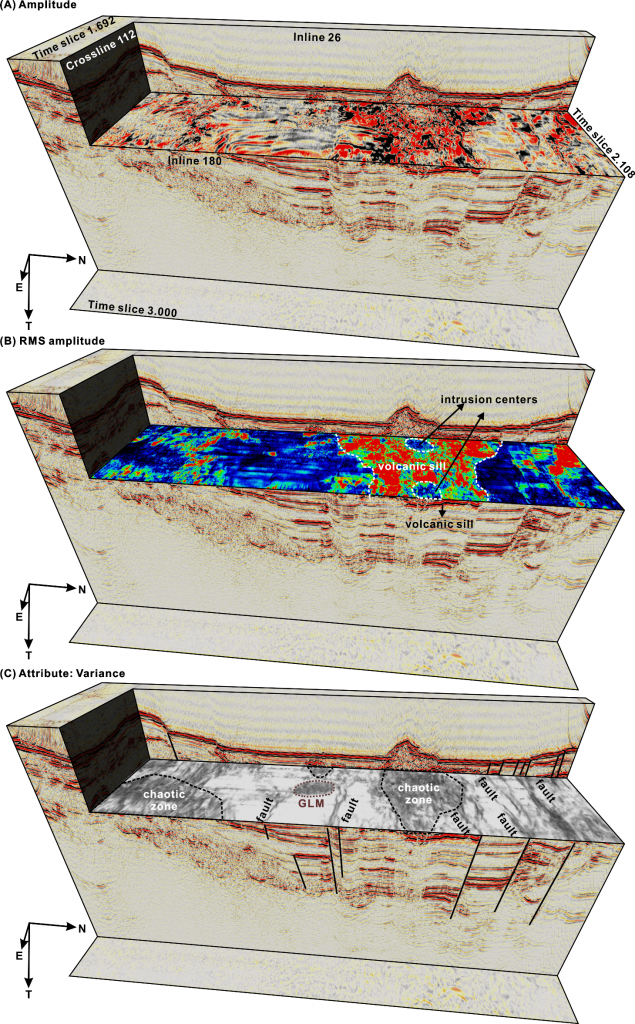
Strong ocean current influences a marine seismic survey and forces the streamer off-course from the survey line. The sideway drift of the streamer results in that the reflection data are no longer distributed in common midpoint gathers along the survey line but become swath distribution on one side of the ship track. This effect is known as “streamer feathering” which degrades the profile image of the 2D processed seismic data. However, if we have long streamer or closely spaced parallel 2D seismic survey lines, we may turn this deleterious effect into a good opportunity to generate 3D seismic volumes with swath distributed reflection data. We present two case studies in which 2D seismic data were collected offshore eastern Taiwan where the strong Kuroshio Current heavily influenced the ship speed and caused large streamer feathering (Fig. 1). The first case is a large-offset 2D seismic profiling data collected using a 6-km long streamer. We processed the swath part of the reflection data in 3D that not only avoids the inappropriate smearing effect in 2D data processing but also generates a 3D seismic volume to help the seismic interpretation (Fig. 2). In the second case, we adjusted our 2D survey strategy when realizing that strong Kuroshio Current was causing significant streamer feathering, and collected a set of closely spaced parallel 2D seismic lines. This multi-swath dataset covers a broad area which enables us to generate a 3D seismic volume. Since our datasets are not real 3D seismic data, we have tailored our processing flows to deal with different data configurations and limitations of each dataset. Our results show that not only we have enhanced 2D seismic images of the originally-interested survey lines, but also provide information on 3D geometry of the geological features imaged. The benefits and limitations of utilizing the streamer feathering effect to generate 3D seismic volumes from 2D seismic profile data are reported. Overall, this approach is a considerable way to handle 2D seismic data with large streamer feathering for both avoiding unreliable 2D seismic images and obtaining information on 3D geometry of the geological features imaged.
 Fig. 1 a Regional map around Taiwan. b Enlarged map shows regional structures and distribution of the datasets used in this study. c Shallow ocean current distribution map shows the strong Kuroshio Current flowing northward east of Taiwan (modified from Liang et al. 2003).
 Fig. 2 Data distribution map of Case 1. Red dots and black dots present shot positions and source-receiver midpoints for every 10 shots. Yellow box shows the area coverage of the generated 3D seismic volume.
Ref.
Lin, L.F., Hsu, H.H., Liu, C.S., Chao, K.H., Ko, C.C., Chiu, S.D., Hsieh, H.S., Ma, Y.F., Chen, S.C., 2019. Marine 3D seismic volumes from 2D seismic survey with large streamer feathering. Marine Geophysical Research 40, 619-633. https://doi.org/10.1007/s11001-019-09391-9
Hsu, H.H., Lin, L.F., Liu, C.S., Chang, J.H., Liao, W.Z., Chen, T.T., Chao, K.H., Lin, S.L., Hsieh, H.S., Chen, S.C., 2019. Pseudo-3D seismic imaging of Geolin Mounds hydrothermal field in the Southern Okinawa Trough offshore NE Taiwan. Terrestrial, Atmospheric and Oceanic Sciences 30, 705-716. https://doi.org/10.3319/TAO.2019.03.14.02


