致沈流風場(downwelling-favorable wind)能產生湧升流嗎?
陳思妤,陳世楠
Ekman transport 是海洋學中重要的物理過程。 Ekman 在1905年對此所提出的概念是: 在北半球,當海洋表面受風應力作用時,表層海水並不會順著風向運動。因為科氏力的作用,表層海水會向風的右手邊偏折,如此才能維持其三個主要作用力(風應力、下層摩擦力與科氏力)的平衡。以相同的概念類推,越遠離表面,洋流偏折的角度持續增加,因而產生我們熟知的 Ekman spiral。另外, Ekman 發現,當我們將此如螺旋般的流場垂直積分後(也就是計算流場的質量傳輸, termed Ekman transport),順著風方向的傳輸為零,質量只會朝風的右手邊傳輸,也就是說, 當海岸位在風行進方向的右側時,風會將表層海水表層向陸地方向傳輸,使得靠岸一側的水位抬升並形成下沉流(downwelling),我們把這樣的風應力稱為 downwelling-favorable wind。反之,當海岸位在風的左側時,則在近岸處產生湧升流(upwelling)。因為海洋的次表層水通常帶有較高的營養鹽,海岸邊經常吹 upwelling-favorable wind 的區域,通常也是全球重要的漁場。
然而,是不是 downwelling-favorable wind 一定會產生 downwelling circulation (表面向岸、底部離岸、岸邊產生下沈的流場)? 2012年 Moffat and Lentz 的數值研究發現,在有水平密度梯度存在的情況下(例如在淡鹹水或不同密度的海水的交界處),downwelling-favorable wind 可能可以引發湧升(upwelling)環流。Chen and Chen (2017) 的工作則是利用簡化的理論與數值模型進一步探討這個反向環流生成的機制。
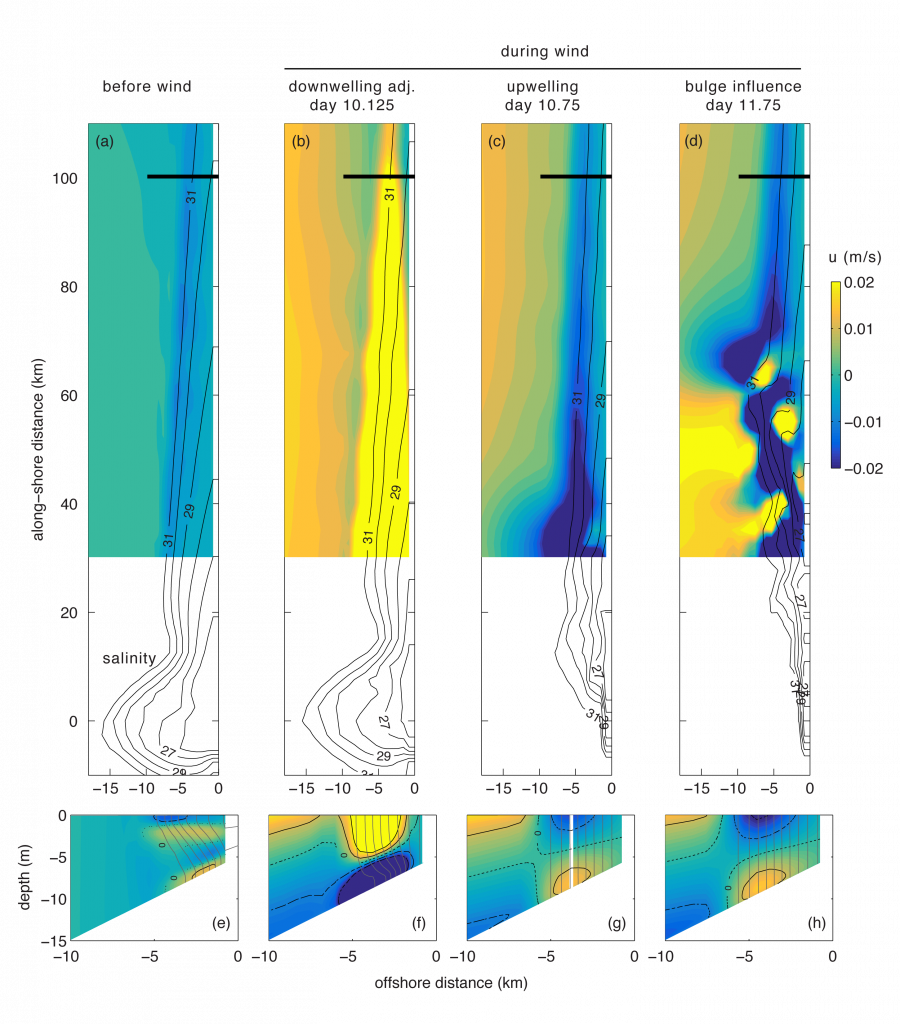
在風場初始,downwelling-favorable wind 確實會引起海水表層向岸和底層離岸的 Ekman transport,形成下沉環流(如圖 b, f)。這個下沈環流會將等密度線推直並增加密度梯度,垂直的等密度線則會傾向產生底層向岸的流場(upwelling; 如圖 c, d, g, h),藉此將等密度線調整回水平(release potential energy)。簡言之,downwelling-favorable wind 作用在水平密度梯度上可以產生兩個方向相反的環流:一為如 Ekman 所述的下沈環流,另一為水平密度梯度調整 (density profile slumps from vertical to horizontal) 所產生的湧升環流。理論模型指出,這兩個環流的相對重要性取決於風與密度梯度的強度,反映在一個新的控制參數上: shear ratio = thermal wind shear (代表密度差) / wind-suported shear (代表風的強度)。當 shear ratio 大於 1 時,密度梯度調整的效應較大,downwelling-favorable wind 便能產生反向的湧升環流。另外,Chen and Chen (2017) 也利用理論模型將海洋環境中風生環流的方向做了簡單的分類,這樣的分類(regime diagram)可以幫助我們理解並預測在什麼樣的環境條件下我們需要考慮密度梯度的效應。
延伸閱讀
Chen, S. Y., and Chen, S. N.* (2017) Generation of Upwelling Circulation under Downwelling-Favorable Wind within Bottom-Attached, Buoyant Coastal Currents. Journal of Physical Oceanography, 47, 2499-2519.
FIG (a-d) Time evolution of surface cross-shore velocity (color) and salinity (black contours spaced at 1 psu) for the BASE case. The corresponding cross-shore structure is shown in (e-h). The blue and yellow indicate offshore and onshore velocity, respectively. The mean (2-day average) structure before wind is shown in (a) and (e). Downwelling wind of 0.1 Pa is applied after day 10. The coastal current responses are divided into three phases: (b, f) initial downwelling circulation, (c, g) steady upwelling circulation, and (d, h) advective influences of upstream bulge. In (a-d), the cross-shore velocity is only plotted for the body of the coastal current to emphasize the coastal current responses. The thick black lines indicate the location of cross-shore transects. In (e-h), the gray contours are the isopycnals, with an interval of 0.2 kg m-3. Zero cross-shore velocity is indicated by the dotted contour lines. The white vertical line in (g) indicates the location of the maximal surface cross-shore velocity and is where the profiles in Fig. 3 and 5 are taken.


